Integrate ChatGPT with OpenAI using pandas-ai

pandas-ai is an OpenAI-supported pandas library for generative AI. With pandas-ai, building data analysis applications using Python is easy. Let's walk through the steps to build one.
Use Case
For any business, gaining valuable insights into target markets, boosting decision-making abilities, and crafting targeted strategies and marketing campaigns is essential. This can be achieved through data analysis. By combining the capabilities of Pandas for data analysis with the power of OpenAI using pandas-ai, the process of analyzing data unlocks unprecedented depths of insights that were not easily attainable before OpenAI.
The common formats for data are CSV and JSON. Let's build a simple application that does the following
- Reads a CSV file. For this example we will use the fitness tracker dataset from Kaggle.
- Applies generative AI to the data set using pandas-ai.
- Gain insights from the data using ChatGPT prompts
The python code is shown below and you can get it from my github
import pandas as pd
import os
from pandasai import PandasAI
from pandasai.llm.openai import OpenAI

df = pd.read_csv('smartwatches.csv')

#print(df.to_string())

OPENAI_API_KEY = os.environ["OPENAI_API_KEY"]
llm = OpenAI(api_token=OPENAI_API_KEY)
pandas_ai = PandasAI(llm)

print(pandas_ai.run(df, prompt='Which is the most expensive Brand'))
print(pandas_ai.run(df, prompt='Which brand has the best quality based on customer ratings and battery life only'))
print(pandas_ai.run(df, prompt='List the brands in terms of quality, where best quality is listed first'))
print(pandas_ai.run(df, prompt='build a line chart based for each brand for quality, make is visually appealing'))
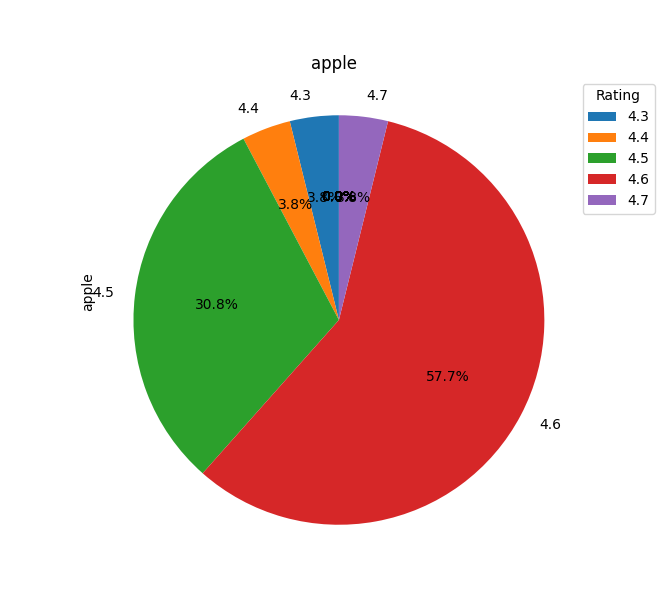
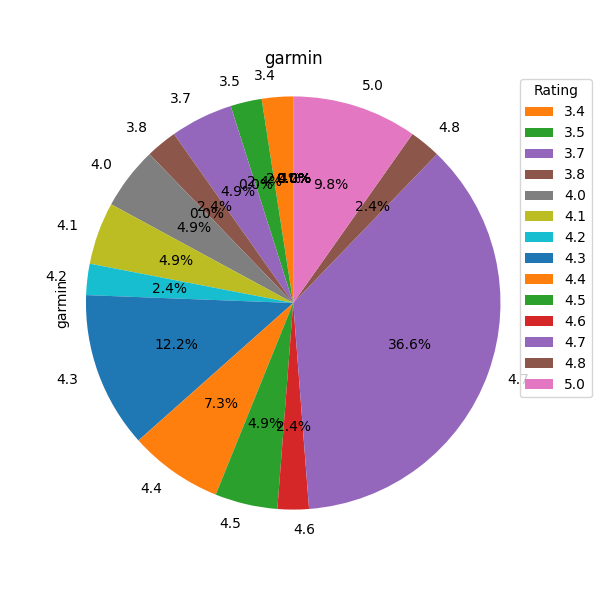
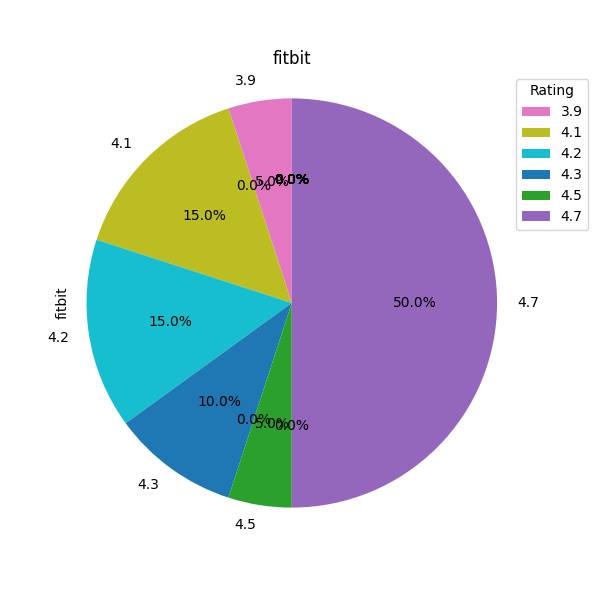
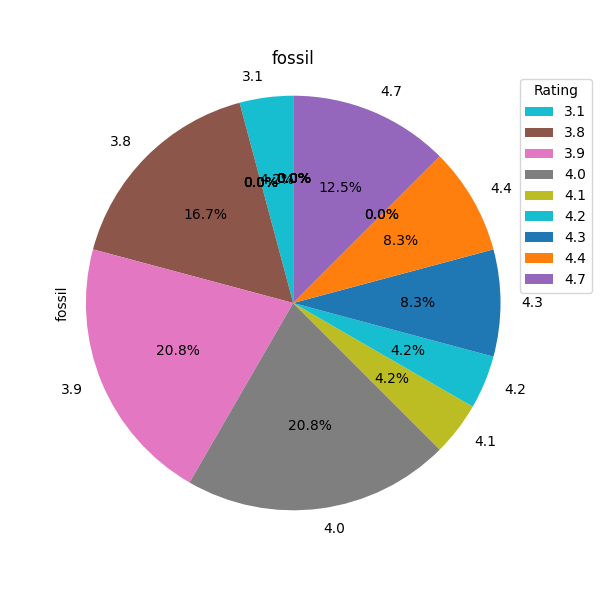
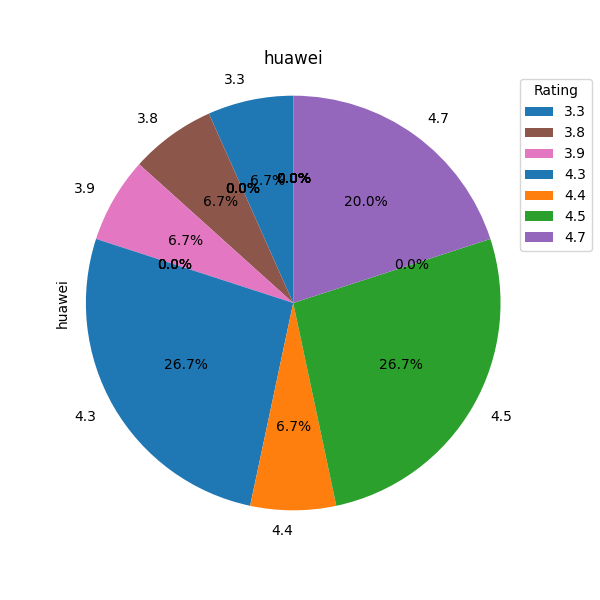
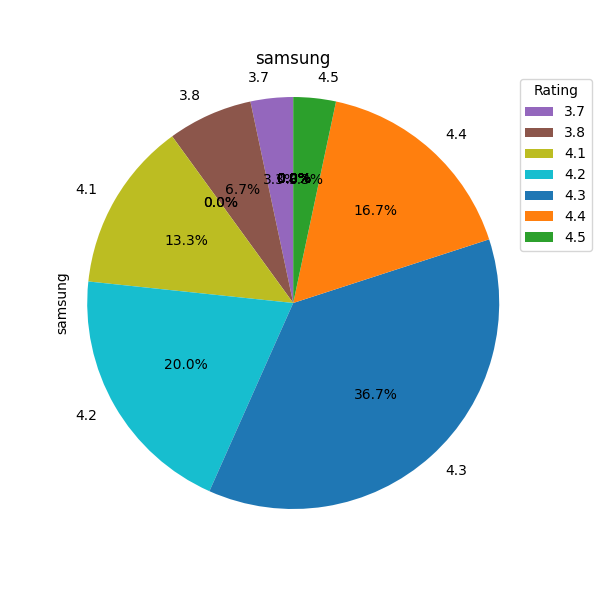
print(pandas_ai.run(df, prompt='build a pie chart based for each brand for quality, make is visually appealing'))
The prompts and the completions are shown below. One thing I noticed was the completions were different sometimes. If the prompt is more focussed then the results are more consistent. Coming up with the correct prompts is iterative process until you validate the completion.
The completions to the prompts in the code are shown below.
Prompt = 'Which is the most expensive Brand'
Completion = Well, if you're looking for the most expensive brand, then it's garmin.
Prompt = 'Which brand has the best quality based on customer ratings and battery life only'
Completion = Based on what customers have said and how long their batteries last, it seems like Apple has the best quality out of all the brands.
Prompt = 'List the brands in terms of quality, where best quality is listed first'
Completion = Sure! Based on their quality, the list of brands starts with Apple at the top, followed by Fitbit, Garmin, Huawei, Honor, Samsung, Amazfit, Crossbeats, Ambrane, Noise, Fossil, Boat, Pebble, Dizo, Gizmore, Zebronics, Hammer, and Fire-Boltt at the bottom.
You can play around with visualization of data prompts. In the example code, I used the chatgpt prompts and not the pandas library which is also rich in building visual graphs and plot.
I tried the following prompts for visualization of data.
The Completion to the prompt is the line graph.
prompt = 'build a line chart based for each brand for quality, make is visually appealing'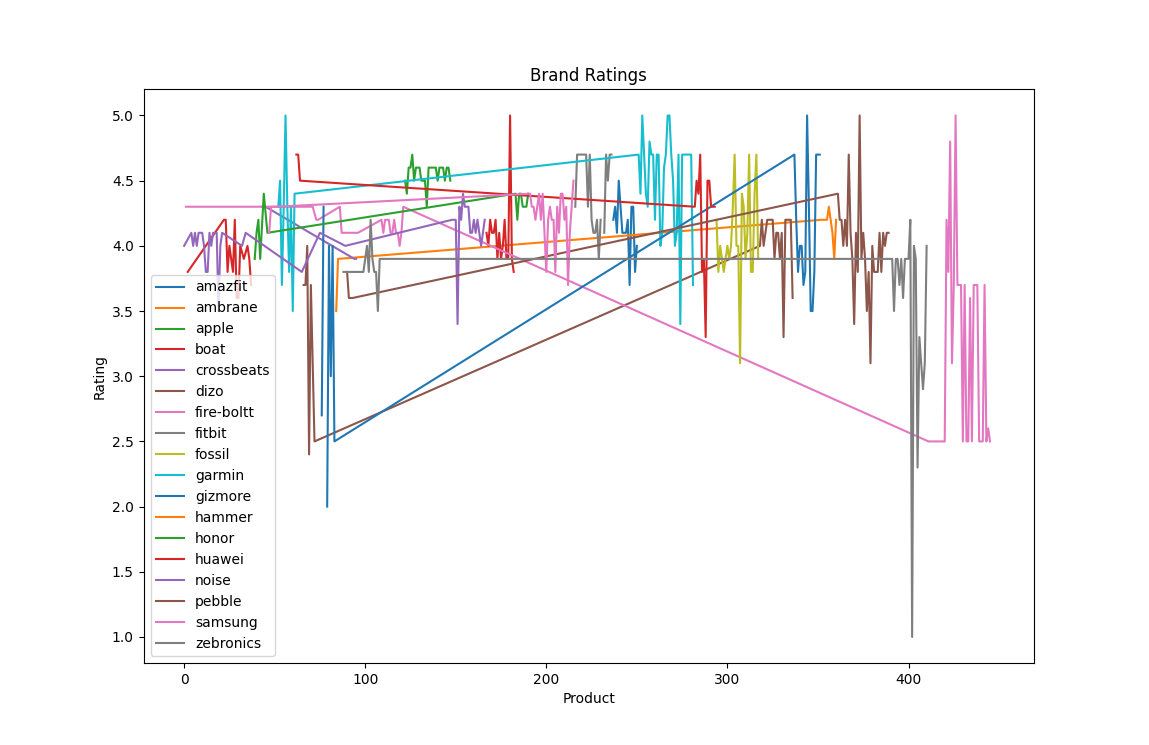
prompt = 'build a pie chart based for each brand for quality, make is visually appealing'
A few quirks I noticed about pandas-ai
- The results were not always consistent, which requires experimenting with parameter tuning.
- Support for tuning the AI parameters does not exist. However, adding parameter tuning to pandas-ai would improve the validity and consistency of the results.
Nonetheless, pandas-ai is a great Python library to get started with and experiment in building data analysis applications.